I still remember the early days of my clinical career, poring over high-resolution chest CTs in children with cystic fibrosis. We’d look for the telltale signs of dilated bronchi, thickened walls, mucus plugs, trying to make sense of structural abnormalities with the naked eye. Even with the best visual scoring systems at our disposal, something always felt incomplete. Too subjective. Too slow. Too much guesswork.
What stayed with me most though, were not only the images themselves, but the enormous gap between what spirometry was telling us and what we knew was happening inside the lung looking at the CT. Most patients showed progressive structural lung damage despite stable spirometry. Some responded to therapies while others did not, and we did not have many treatment options to stop progression. The CT held the answer whether therapy was effective yes or no. However, the CT evaluation in our clinical practice depended on our expertise and what we could see with our eyes.
That was the seed for my fascination with AI, followed by 30 years of research in the field, and then everything we do at Thirona.
We were trying to navigate a bronchiectasis disease… without a proper map.
The Problem: A Disease Too Complex for the Tools We Had
Bronchiectasis disease isn’t a single disease – it’s a final common pathway for many. From primary ciliary dyskinesia and post-infectious damage to chronic inflammation and mucus clearance dysfunction, the underlying causes differ widely, and so do the structural manifestations on CT.[1]
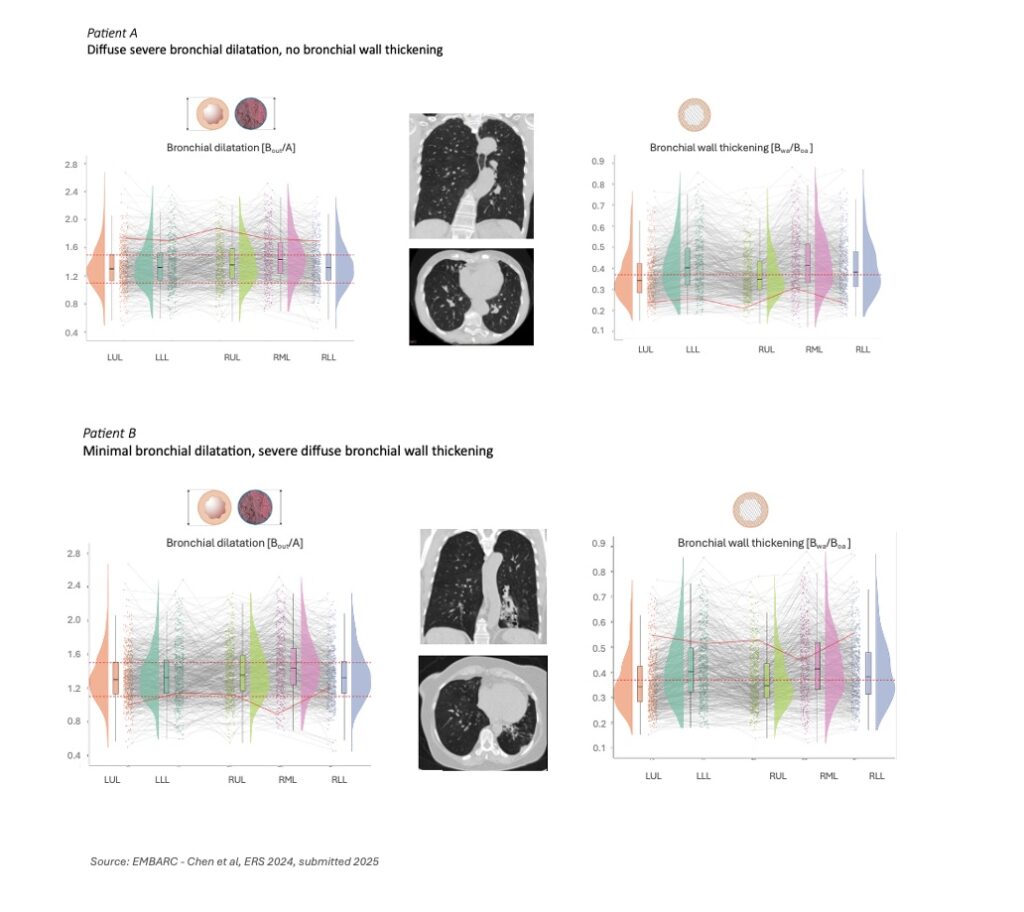
This heterogeneity within and between patients makes it exceptionally hard to run clinical trials. Two patients may both carry the same diagnosis yet have fundamentally different structural disease patterns: one with diffuse airway wall thickening, another with severe dilation and mucus impaction. Traditional imaging reads simply don’t capture this variation with the accuracy needed to stratify patients or measure treatment response.
Worse yet, our go-to endpoints like exacerbation rates or FEV1 (Forced Expiratory Volume in one second – a crucial measurement in pulmonary function testing) often miss the mark. FEV1 may remain unchanged while underlying structural abnormalities are progressing. Exacerbations are erratic, difficult to define, and are influenced by external triggers and reporting bias. And visual CT scoring, even when performed by experienced clinicians, remains subjective and time-consuming, with high variability across readers and sites. In essence, we were trying to navigate a bronchiectasis disease… without a proper map.
The heterogeneity within and between patients makes it exceptionally hard to run clinical trials in bronchiectasis.
A Turning Point: When AI Meets the Lung
And here we are today, with AI bringing a whole new dimension to image interpretation, not only advancing but holding the potential to transform treatment of lung diseases. The emerging solutions come not from a new drug or device, but from a new way of seeing.
Using deep learning algorithms, at Thirona we trained our LungQ® software to extract precise, quantitative measurements from CT scans – automatically and reproducibly. We weren’t just looking at the airways anymore, but measuring them down to the submillimeter, and we can now quantify:
- The degree of bronchial dilation, generation by generation.
- The extent of wall thickening across lobes and segments.
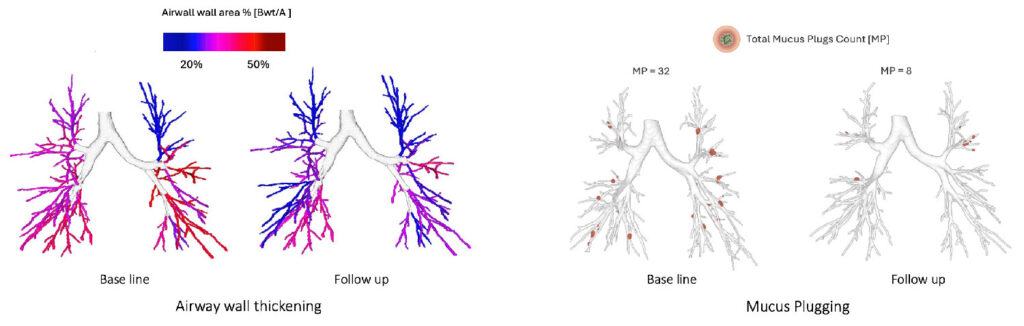
- The volume, number, and location of mucus plugs.
- The pulmonary blood volume distribution and its response to treatment.
Analyzing patterns across various bronchiectasis patient populations in multiple studies, we find patients with extensive wall thickening and minimal dilation[2], an image that would often go unnoticed in traditional visual reads. Others show diffuse dilation with little thickening. Mucus plug burden varied dramatically, from none to hundreds per lung. These structural phenotypes are no longer anecdotal observations – they become measurable, classifiable, and clinically actionable.
In a study of over 600 bronchiectasis patients from the EMBARC registry, we can see it clearly: this disease does not follow one path, and it certainly doesn’t respond to treatment in a uniform way.[3]
What This Means for Respiratory Trials
What strikes me most is how these AI-derived imaging metrics are redefining the way we can conduct clinical trials in bronchiectasis disease, and across respiratory disease more broadly.
By moving from subjective visual reads to automated, quantitative metrics, we gain a level of reproducibility and sensitivity that traditional endpoints simply can’t offer. For instance, structural metrics such as bronchial wall thickness or mucus plug number can reveal meaningful treatment effects even when spirometry remains unchanged[4], which brings a critical advantage in phase 2 and 3 studies where sensitive and accurate signals matter.
Moreover, this level of granularity allows us to track regional disease activity, at lobar or even segmental level, and understand where therapies are acting, and where they are not.[5] These insights turn imaging into a source of functional biomarkers, supporting both patient stratification and therapeutic mechanism-of-action studies.
Final Reflections: Toward a More Complete Understanding of Each Patient
For me, the greatest value of AI-powered imaging lies not in the technology itself, but in what it enables – a clearer, more complete in-depth view of each patient’s disease.
Bronchiectasis used to be the condition we saw too late, understood too generally, and treated too broadly. But with AI imaging, we can now characterize the disease in far greater anatomical and functional detail, and do so in a way that is reproducible, fast, and clinically meaningful.
We can identify patients with predominantly mucus-dominated phenotypes versus those without mucus plugs but with severe wall thickening or subtle peripheral bronchial dilation. We can track disease activity over time and visualize the impact of a treatment at the segmental level. We no longer need to infer what’s happening – we can measure it.
And this is changing everything. It can empower clinicians to tailor therapy to the patient more precisely. It offers sponsors the ability to match the right drug with the right patient. And it allows all of us, across the ecosystem, to move one step closer to true precision medicine in respiratory care.
And at the end of the road, this isn’t about replacing the radiologist or the pulmonologist. It’s about equipping them with sharper tools that translate the complexity of lung disease into insight we can act on. And ultimately, it’s about serving patients not just more quickly, but with sensitive, standardized analyses that allow for greater impact on their health and quality of life.
Reference publications:
[1] A Pieters, T Van Der Veer et al, The spectrum of structural lung changes in bronchiectasis: Analysis of 524 EMBARC CTs, European Respiratory Journal 2023 62(suppl 67): PA1074; https://doi.org/10.1183/13993003.congress-2023.PA1074
[2] H.A. Tiddens, A. Van Beukering-Pieters et al, Automatic Analysis of Bronchus-artery Dimensions and Ratios of 625 Chest CTs of Bronchiectasis Patients Participating in the EMBARC Registry, American Journal of Respiratory and Critical Care Medicine 2024;209:A5177; https://doi.org/10.1164/ajrccm-conference.2024.209.1_MeetingAbstracts.A5177
[3] Y Chen, A Pieters et al, Automatic analysis of bronchus-artery ratios and mucus plugs of 640 chest CTs of EMBARC bronchiectasis patients, European Respiratory Journal 2024 64(suppl 68): PA652; https://doi.org/10.1183/13993003.congress-2024.PA652
[4] I Sermet-Gaudelus, A Letierce et al, Effect of elexacaftor–tezacaftor–ivacaftor on bronchial dilatations in adolescents with cystic fibrosis: a multicentre prospective observational study, The Lancet, Oct 2025; 10.1016/S2213-2600(25)00248-6
[5] Y Chen, A Pieters et al, Lobar differences on chest CTs of bronchiectasis patients from the EMBARC registry, European Respiratory Journal 2025 66(suppl 69): PA5737; https://doi.org/10.1183/13993003.congress-2025.PA5737 | https://doi.org/10.1183/13993003.congress-2024.PA652
Contact us to explore how Thirona can support your trial with standardized, AI-enhanced lung imaging and help you unlock the full potential of imaging outcome measures.