
By Prof. dr. Harm Tiddens, MD
One of the first questions I hear when clinical trial teams, researchers or pulmonologists begin working with quantitative CT is remarkably simple:
“What are the normal values?”
It is an understandable question. Medicine has taught us to think in reference ranges. Measurements such as blood glucose, blood pressure and lung function (FEV₁) have established reference values that help distinguish normal from abnormal. A reference value describes how a measurement is distributed in a healthy reference population, typically expressed as percentiles or z-scores and adjusted for predictors such as age, sex and height. It is not a diagnostic cut-off: a value outside the reference range is statistically unusual, not automatically abnormal, and a value inside it does not exclude disease. Conventional radiological CT assessment also relies on diagnostic criteria, although these are often qualitative or based on relatively simple measurements. For example, a bronchus wider than its accompanying artery may indicate bronchiectasis, low-attenuation areas are assessed for emphysema, and mosaic attenuation pattern on expiration may indicate trapped air. There are no robust reference values available for these assessments: the bronchus-to-artery ratio, for instance, changes with age in healthy individuals, so age dependent cut-off values are needed.⁴
Quantitative imaging makes it possible to reconsider how we define normal and abnormal lung structure. AI allows us to measure hundreds of airways on a single CT scan and quantify structural abnormalities throughout the lungs. However, interpreting these measurements requires accounting for age, sex, body size, anatomical location and differences between patient populations, as well as the CT acquisition protocol.
Why no single reference range fits every lung
Every lung is different. Airway dimensions vary with age, sex, body size, smoking history and normal anatomical variation. Even healthy lungs show regional differences that should not automatically be interpreted as disease.¹
Disease is equally heterogeneous in the type, severity and extent of structural abnormalities.6 Two patients with COPD with the same reduction in FEV1/FVC may have very different structural profiles: one may have predominantly emphysema, while another has extensive airway remodeling with little emphysema. Their disease progression and response to treatment are likely to differ.
These differences occur not only between patients but also within individual lungs.8 One lobe may show severe disease while another is relatively unaffected.
Quantitative imaging now offers the opportunity to establish reference values for multiple structural components of the lung, not only at the whole-lung level but also at the lobar and segmental levels. Establishing these values requires large cohorts of healthy individuals scanned with standardized protocols; determining which deviations matter clinically requires separate outcome studies in patients. Reference values are most reliable for the CT acquisition protocol, population, sex and age range in which they were established.4-5
Enhancing visual assessment with AI
Visual assessment of a chest CT typically focuses on a relatively small number of airways and is most sensitive to severe abnormalities. AI can analyze most of the hundreds of airways visible on a CT, quantify subtle changes that are difficult to recognize visually, identify the airway generations involved and measure how abnormalities evolve over time.
This does not replace expert interpretation. It provides the clinician and radiologist with more comprehensive, objective and sensitive information.
Quantitative biomarkers are not diagnostic labels
One misconception about quantitative imaging is that CT biomarkers can already be interpreted in the same way as established laboratory measurements. For many of them, we still lack sufficiently validated reference values.
For example, a slightly increased bronchial wall thickness may reflect suboptimal inspiration during CT acquisition or normal age-related changes.2 However, it may also indicate early inflammatory disease or smoking-related airway remodeling.
A single quantitative measurement rarely establishes a diagnosis. Its interpretation depends on the expected normal range, the presence of other structural abnormalities and the patient’s clinical characteristics.
AI can quantify structural changes associated with asthma, COPD, cystic fibrosis and bronchiectasis. However, without appropriate reference values, we currently cannot reliably determine which measurements are abnormal for an individual patient or what proportion of their airways is affected.
Looking beyond individual numbers: three examples where context matters
Consider two patients with exactly the same average bronchial wall thickness. One has relatively homogeneous measurements throughout the lungs. The other has pronounced wall thickening confined to one lobe, with relatively normal measurements elsewhere.
A single whole-lung average would make them look the same, yet their structural disease patterns are clearly different. They may also respond differently to treatment.
AI can quantify this heterogeneity by measuring abnormalities at the lobar and segmental levels and monitoring changes over time. Figure 1 illustrates this in a patient with cystic fibrosis before and after elexacaftor–tezacaftor–ivacaftor (ETI) therapy. At baseline, wall thickness and bronchial dilatation varied widely between segments. After treatment, wall thickness decreased in most segments whereas bronchial dilatation changed little.
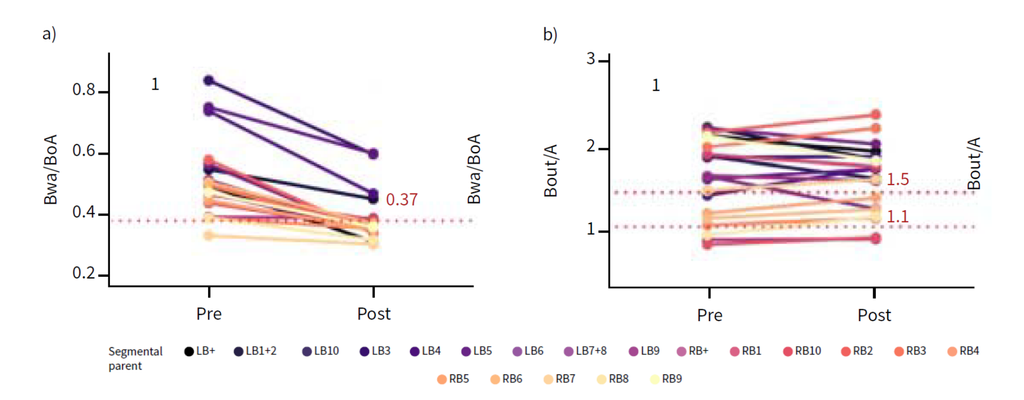
Figure 1: a) Bronchial wall thickness (Bwa/Boa) pre- and post-1.5 year of elexacaftor–tezacaftor–ivacaftor therapy in one patient. b) Bronchial dilatation (Bout/A) pre- and post-1.5 year of ETI therapy in the same patient. The red dotted line represents the 95th percentile threshold for normal subjects. Colors of the lines refer to the segmental labels shown at the bottom of the figure.
Source: Aliukonyte et al; Bronchial segmental heterogeneity of responsiveness to modulator therapy in cystic fibrosis: linking structural improvements on computed tomography to inflammation in bronchoalveolar lavage fluid, ERJ Open Research 2026
Bronchial measurements
Bronchial dilatation and wall thickening have traditionally been assessed by comparing the bronchus with its accompanying artery. Although useful, this approach has important limitations.
Because the bronchus-to-artery ratio depends on both bronchial and arterial dimensions, changes in the artery, such as those that occur in emphysema, also alter the ratio and may either mimic or mask bronchial dilatation.
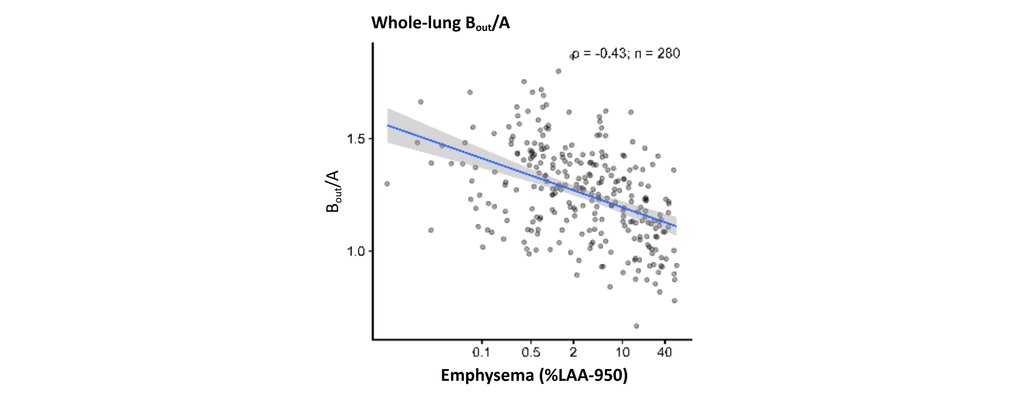
Figure 2: Whole-lung analyses demonstrate lower bronchus–artery ratios with increasing emphysema severity
Source: Van der Veer et al; Bronchiectasis Without Dilatation? How Emphysema Confounds CT Diagnosis, WBC conference abstract 2026
AI addresses this limitation by providing measurements wall thickness and bronchial dilatation which do not require comparison with arterial dimensions.7-10
Measuring these abnormalities regionally reveals relationships between them that whole-lung averages conceal. For example, bronchial wall thickening accompanied by widespread bronchial dilatation and mucus plugging may represent a different disease pattern from isolated wall thickening in one lobe.
Trapped air and emphysema
Emphysema and trapped air are established CT biomarkers, commonly quantified using lung density thresholds (typically below −950 HU on inspiratory CT for emphysema and below -856 HU on expiratory CT for trapped air). However, both measurements are sensitive to the level of lung inflation during scanning.
Their anatomical distribution is also important. Two patients may have the same total emphysema burden but markedly different regional distributions, degrees of air trapping and associated airway abnormalities.10
Combining density-based measurements with quantitative bronchial measurements can help characterize these differences and distinguish airway-dominant from emphysema-dominant disease patterns in patients with COPD.³
Mucus plugs
Mucus plugging provides another example of why the total burden of an abnormality is only part of the picture.
A small number of mucus plugs in one lobe may occur during an acute respiratory infection. However, persistent or widespread mucus plugging may indicate chronic airway disease and can be associated with disease progression.
AI can automatically detect, count and compute the volume and density of mucus plugs visible on CT and map their anatomical distribution.11, 12 Repeated measurements allow us to determine whether plugs persist, disappear or develop in previously unaffected regions.11,12
This matters when evaluating treatment response: a reduction in the total number of mucus plugs does not necessarily mean that all affected lung regions have improved.
What quantification does not solve
Greater measurement sensitivity does not automatically translate into greater diagnostic certainty. A reference value is only as meaningful as the measurement compared against it.
Quantitative CT measurements are influenced by scanner characteristics, reconstruction algorithms and lung inflation. Differences in acquisition protocols may therefore produce apparent changes that do not reflect actual changes in lung structure.2
This is particularly important in multicenter clinical trials and longitudinal studies, where small treatment effects must be distinguished from scan-related differences, and in clinical care, where changes between follow-up scans should reflect the disease rather than the scan.
Reference values established in one population or with one acquisition protocol cannot automatically be applied to another, and algorithms validated in one disease population need to be evaluated before being applied to others. Without this foundation, differences between patients or changes over time risk being misinterpreted. Robust standardization of the CT acquisition and validation are therefore not a technical detail, but a prerequisite for meaningful reference values.
From “normal” to clinically relevant
Quantitative CT allows us to move beyond whole-lung measurements toward a more comprehensive phenotyping of structural lung disease.
Patients with the same clinical diagnosis may have very different combinations of bronchial dilatation, wall thickening, emphysema, trapped air and mucus plugging. Their anatomical distribution and severity may also differ substantially.7,13,14
For pharmaceutical research, using these measurements in new therapy development offers opportunities to select and stratify patient populations more precisely, investigate disease progression and objectively assess treatment response.
For clinicians, combining quantitative CT with lung function, biological markers and clinical findings is likely to improve identification of clinically relevant disease characteristics and potentially treatable traits.15
However, to apply quantitative imaging effectively in individual patients, we need reliable reference values that account for normal biological variation. Furthermore, we need to establish which measurements, distributions and combinations of abnormalities are associated with clinically meaningful outcomes.
After years of hearing “What are the normal values?” I believe the more relevant question is:
“What is normal for this patient?”
Answering that question will require both appropriate reference values and the integration of quantitative imaging with clinical information. A growing number of studies, including EMBARC-BRIDGE in bronchiectasis and the Sherlock study in COPD, are already moving in that direction by combining AI-derived CT metrics with molecular and physiological data. In the end, the answer to “What are the normal values?” is not a single reference range, but a path to more personalized, precision treatment.
Reference publications
- Maetani T et al; Airway trees in the Anthropocene. Journal of Applied Physiology; 2022
- Chen et al; Effect of inspiratory lung volume on bronchial and arterial dimensions and ratios on chest computed tomography in patients with chronic obstructive pulmonary disease, European Radiology; 2025
- Van der Veer et al; Automated analysis of airway remodeling and emphysema across GOLD Stages: Insights in COPD Severity, European Respiratory Journal; 2025
- Lv et al; Normative values for lung, bronchial sizes and bronchus-artery ratios in chest CT scans: from infancy into young adulthood, European Radiology; 2025
- Latisenko et al; Assessment of 10-year progression in COPDGene using automated measurements of bronchus-artery ratios and mucus plugging, American Journal of Respiratory and Critical Care Medicine; 2025
- Chen et al; Automatic analysis of bronchus-artery ratios and mucus plugs of 640 chest CTs of EMBARC bronchiectasis patients, European Respiratory Journal; 2024
- Chen et al; Progression of structural lung disease and lung function in adolescents with cystic fibrosis, Journal of Cystic Fibrosis; 2026
- Chen et al; Lobar heterogeneity on chest CTs of bronchiectasis patients from the EMBARC registry; European Respiratory Journal; 2025
- Van der Veer et al; Association between automatic AI-based quantification of airway-occlusive mucus plugs and all-cause mortality in patients with COPD; Thorax; 2025
- Van der Veer et al; Quantitative CT reveals emphysema heterogeneity as a modifier of lobar airway structure in COPD (presented at ERS 2026)
- Humphries et al; Concordance of Visual and Artificial Intelligence–Based Mucus Plug Detection on Computed Tomography in the COPDGene Study, American Journal of Respiratory and Critical Care Medicine; 2026
- Chen et al; Automatic CT analysis of structural lung abnormalities in 609 bronchiectasis patients: insights from the EMBARC registry (submitted)
- Pieters et al; Structural Lung Disease and Clinical Phenotype in Bronchiectasis Patients: The EMBARC CT study, American Journal of Respiratory and Critical Care Medicine; 2024
- Van der Veer et al; Automated computed tomographic analysis of bronchial thickness and mucus plugs in bronchiectasis with asthma; ERJ Open Res; 2025
- Saimi et al; Identification of CT-based structural alterations resembling COPD in individuals without airflow obstruction (presented at ERS 2026)